Google Maps Data for Market Trend Analysis
Jan 11, 2026

Google Maps data isn't just for navigation - it’s a powerful resource for businesses to analyze market trends, identify growth opportunities, and make smarter decisions. By leveraging data like customer reviews, search trends, and business locations, industries such as HVAC, landscaping, and catering can pinpoint underserved areas, track competitors, and optimize operations.
Key Takeaways:
Market Trend Analysis: Understand customer demand and locate areas with high potential but low competition.
Google Maps Insights: Use metrics like direction requests, search queries, and AI-driven review summaries to gauge customer sentiment and business performance.
AI Tools: Automate data collection and analysis with platforms that simplify geospatial data into actionable insights.
Data Strategy: Set clear objectives, focus on relevant metrics, and define geographic boundaries to guide your analysis.
Growth Opportunities: Identify underserved markets using competitor density, service demand, and operational gaps.
Businesses can use tools like the Google Places API, web scraping software, or AI platforms to collect and prepare data. Cleaning and standardizing this information ensures accuracy, while advanced analytics and external datasets provide a deeper understanding of market dynamics. By applying these insights, businesses can fine-tune their strategies, expand into high-potential areas, and optimize lead generation efforts.
Local Market Analysis Using Google Maps Search Results and Google Business Reviews
Planning Your Data Collection Strategy
Multi-Layered Geographic Analysis Framework for Market Opportunity Identification
After gathering initial market insights and leveraging AI-driven data collection, the next step is crafting a solid plan for your data strategy. Whether you're a restaurant owner expanding into a new city or an HVAC company monitoring competitors across multiple counties, your approach needs to reflect your specific goals. The strategy you develop should align with earlier market trend analysis, ensuring that your data collection efforts are purposeful and actionable.
Setting Clear Objectives
Start by defining your objectives and identifying the key metrics that matter most to your business. For instance, competitive analysis can help you spot areas where competitors are concentrated [4]. If your focus is on site selection, look for regions with a high density of consumers but limited service providers [4]. For real estate investment firms, amenity mapping - tracking nearby transit stations, hospitals, or grocery stores - can be critical for calculating property ROI [4].
For example, a delivery service used the Places Aggregate API to count nearby establishments, enabling them to allocate resources more effectively [4].
This same data-driven approach applies to local service businesses like landscaping, janitorial, and HVAC services. Knowing where demand is concentrated allows you to allocate resources where they’ll make the most impact [4].
Another key metric to consider is brand visibility benchmarking, which measures your "share of search" compared to competitors. On average, this metric accounts for 83% of a brand's actual market share [6]. Increasing search volumes often indicate future revenue growth, with data-based strategies delivering 2-3% higher returns than traditional approaches [6].
Identifying Key Data Points
Zero in on the data points that are most relevant to your goals. These typically include business identity details (like name, Place ID, and type), geographic coordinates (latitude, longitude, and ZIP codes), and operational status [8][10].
Other useful indicators include:
Performance metrics: Average ratings (on a 1.0 to 5.0 scale) and user rating counts, which can signal popularity and customer volume [10].
Price level data: Ranging from free to very expensive, this helps you understand local consumer spending habits [8].
AI-driven review summaries: These provide insights into customer sentiments and common pain points [3].
Operating hours: Knowing when competitors are open can help you identify peak service windows and areas of unmet demand [2][10].
Once you've identified the key data points, set clear geographic boundaries to guide your analysis.
Determining Geographic Scope
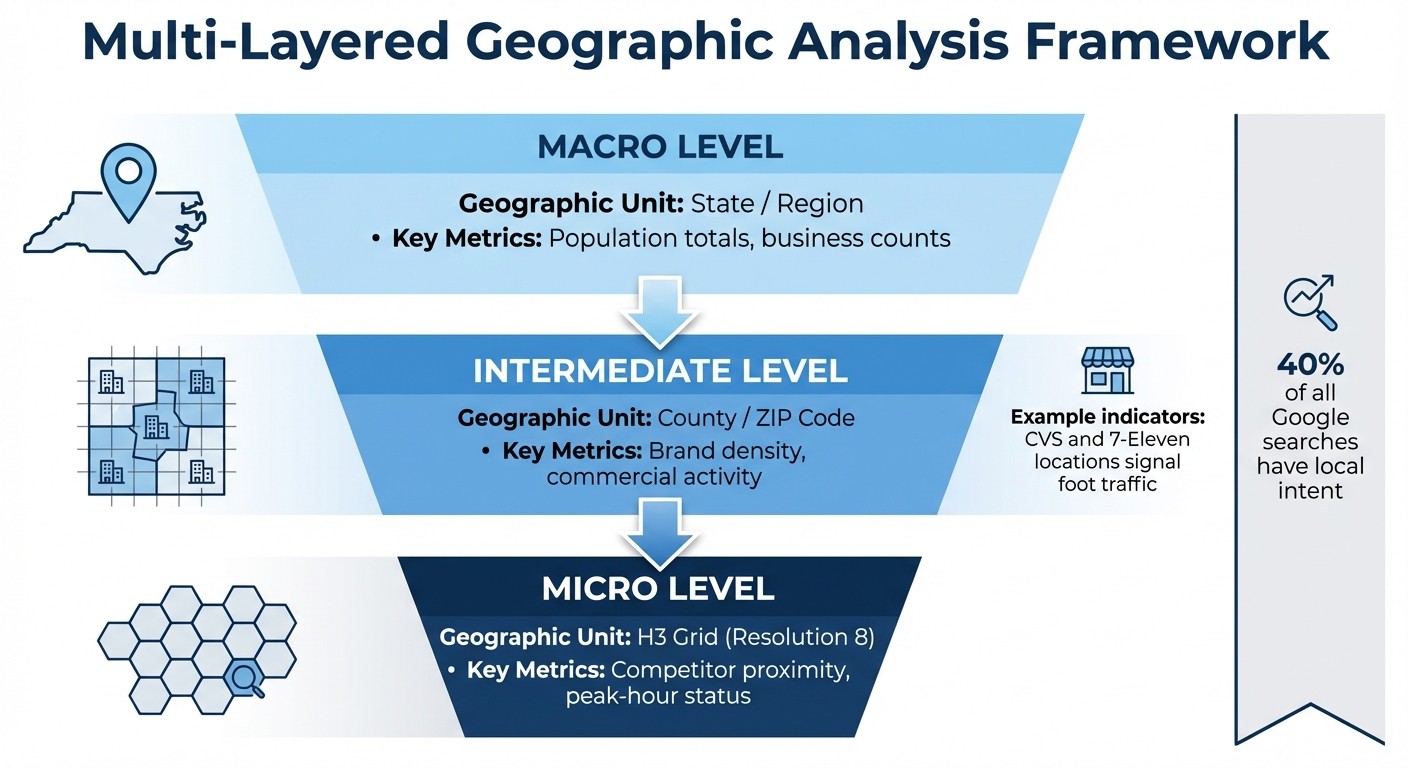
A multi-layered funnel approach is ideal for defining your geographic scope [2]. Start broad and gradually narrow your focus:
State level: Use population data and business density to identify promising counties.
County or metro level: Pinpoint ZIP codes with high commercial activity. Major brands like CVS and 7-Eleven can serve as indicators of strong foot traffic [2].
Hyper-local analysis: Use H3 hexagonal grids at resolution 8 to score individual blocks based on their proximity to complementary businesses [2].
For instance, analysts combined population metrics, brand density, and H3 grids to locate optimal micro-areas [2].
This method works well for any local service business. By starting wide and zooming in where the data points to opportunity, you can maximize efficiency and avoid wasting resources.
Analysis Level | Geographic Unit | Key Metrics |
|---|---|---|
Macro | State / Region | Population totals, business counts [2] |
Intermediate | County / ZIP Code | Brand density, commercial activity [2] |
Micro | H3 Grid (Res 8) | Competitor proximity, peak-hour status [2] |
With 40% of all Google searches having local intent [7], precise geographic targeting is essential. Whether you're using administrative areas like ZIP codes, geometric shapes like circles with specific radii, or custom polygons tailored to your service area, defining your boundaries effectively can mean the difference between uncovering real opportunities and chasing irrelevant data [10][4].
Collecting and Preparing Google Maps Data
Once you have a clear strategy, the next step is gathering and preparing Google Maps data to fuel your market trend analysis. Google Maps hosts information on 200 million businesses across 4,000 categories [12]. The key challenge lies in extracting this data efficiently while ensuring compliance with legal and ethical standards. It's essential to review your collection methods to strike a balance between comprehensive data acquisition and adherence to guidelines.
Data Collection Methods
There are three primary ways to collect data:
Google Places API: This tool provides access to business names, addresses, ratings, and coordinates through features like Text Search and Nearby Search [9]. However, it has a limitation of 60 results per query, which can be restrictive for large-scale analyses [11].
Web scraping tools: Platforms like Apify, Scrap.io, and Outscraper can extract publicly available data, including business names, phone numbers, ratings, and reviews, and export it into structured formats like CSV or JSON [11][12][13]. Many of these tools offer free versions or affordable scaling options [12][13].
"Google Maps scraping for publicly available business information is generally legal when done responsibly."
– Scrap.io [12]
AI platforms: For local service businesses, tools like Cohesive AI can automate both data scraping and enrichment.
When collecting data, it's crucial to act ethically. Avoid extracting personal information and ensure you use appropriate request rates to prevent overloading servers [11][12][14].
Cleaning and Standardizing Data
Raw data from Google Maps often contains duplicates, inconsistencies, and inactive listings, so refining it is essential. Start by removing duplicates by matching business names with normalized addresses or coordinates [14][17].
Standardize addresses by separating them into fields like street, city, state, and postal code. This makes it easier to integrate with regional data or CRM systems [13][16]. Similarly, format phone numbers according to the E.164 standard [14].
Aligning business categories is another critical step. Remove technical prefixes like "gcid:" and map businesses to standard taxonomies based on their primary category [15][16]. Exclude listings marked as "permanently closed" or "temporarily closed" to ensure your dataset focuses on active leads [12]. If you're adding email addresses, validate them with third-party services to reduce bounce rates [14][17].
Structuring Data for Analysis
After cleaning, organize your dataset for analysis. Use unique identifiers like Google's Place ID or CID to track locations accurately and avoid duplicates when integrating with external data sources [13][10]. Include geospatial coordinates (latitude and longitude with six decimal places) for precise mapping and location intelligence [16].
Add temporal metadata, such as scraped_date and search_term, to monitor trends over time [14]. Breaking down business types into primary_type and subtypes allows for more detailed filtering and niche market analysis [13][10].
Data Category | Key Fields | Purpose |
|---|---|---|
Identity | Place ID, Google ID, Business Name | Unique identification and cross-referencing |
Location | Latitude, Longitude, Postal Code | Geospatial mapping and regional clustering |
Performance | Rating, Reviews Count, Price Level | Benchmarking and consumer sentiment |
Operations | Working Hours, Business Status | Market activity and service availability |
Finally, export your dataset in CSV or Excel format for tools like Tableau or Power BI, or in JSON format for programmatic use in CRM systems [13][11]. For more focused analysis, consider filtering for businesses with ratings above 4.0 or those that have claimed their Google Maps listing [14][12]. A well-structured dataset like this serves as the foundation for detailed market insights.
Analyzing Market Trends with Google Maps Data
Transform raw data into actionable insights that uncover opportunities in your target regions. This process helps identify market saturation, customer demand, and competitive gaps by analyzing key indicators, using advanced analytics, and integrating external datasets.
Key Market Indicators
Understanding market trends starts with tracking critical indicators. For instance, competitor density offers a snapshot of market saturation. By applying spatial aggregation methods like H3 hexagonal indexing (resolution 8), you can pinpoint "hotspots" where competitors are concentrated and areas that might be underserved [1][2].
Service demand is another key metric, often inferred from search behavior. The Business Profile API provides two useful metrics: QUERIES_DIRECT (brand-specific searches) and QUERIES_INDIRECT (category searches). High indirect search volume in regions with low competitor density can highlight areas ripe for new business opportunities [5].
Operational gaps also reveal potential. By filtering data with regular_opening_hours, you can detect areas where businesses are closed during high-demand periods, like late mornings or lunch hours. For local services like HVAC or landscaping, matching operating hours to peak demand can expose untapped neighborhoods [1][2].
Indicator | Data Method | Market Insight Provided |
|---|---|---|
Competitor Density |
| |
Service Demand |
| Tracks user intent and local service interest [5] |
Market Saturation |
| |
Foot Traffic Proxy | Brand density (e.g., 7-Eleven, McDonald's) | Identifies high-activity commercial zones [2] |
Using Advanced Analytics
To dig deeper, advanced analytics can refine your market understanding. Weighted suitability modeling, for example, assigns multipliers to business types, creating a composite market opportunity score. This approach can highlight underserved areas, even in competitive regions.
Min-max normalization is another valuable tool. It standardizes different metrics, like population counts and business density, onto a 0–1 scale. This allows you to combine factors like foot traffic, competitor ratings, and pricing into a single "market opportunity score" for each grid cell [2].
Temporal filtering adds a dynamic layer to your analysis. By setting parameters for "Day of Week" and "Hour of Day" in tools like Looker Studio, you can uncover when demand spikes and compare it to service availability [1].
"This workflow, combining the scale of BigQuery, the richness of Places Insights, and the real-time detail of the Places API, provides a powerful template for any organization looking to use location intelligence for strategic growth."
– Henrik Valve, DevX Engineer, Google [2]
Combining Data with External Sources
Google Maps data becomes even more powerful when paired with external datasets. Tools like BigQuery integration make it easy to merge Places Insights with resources like US Census Bureau data or economic reports. This allows you to calculate metrics like per-capita market saturation - for example, determining how many HVAC companies serve every 10,000 residents in a county [2].
Geospatial joining is another technique for enhancing your analysis. By overlaying ZIP code boundaries or county geometries onto your Google Maps data using functions like ST_DWITHIN or ST_CONTAINS, you can create localized market scores that consider both business activity and demographic factors. Research from the IMF has shown that combining Google data with economic metrics can effectively predict GDP trends, underscoring the value of this approach [18].
Platforms like Cohesive AI streamline this process, automating data integration and turning insights into actionable leads. This reduces the manual effort of merging datasets, allowing you to focus on strategy.
When merging data, assigning weighted scores ensures the most relevant factors influence your decisions. For instance, you might allocate 50% weight to population density from Census data and 50% to competitor density from Google Maps to create a balanced suitability score [2].
Applying Insights to Business Strategies
Identifying Growth Opportunities
Using Google Maps data, you can uncover growth opportunities by layering your analysis. Start broad - look at the state level - then narrow your focus to counties with a favorable balance of population versus competitors. From there, drill down further using ZIP codes and tools like H3 grid indexing to zero in on specific market gaps where demand outpaces supply.
Take this example: A coffee shop chain looking to expand in Nevada used this method to identify underserved areas near busy transit zones. The team pinpointed Clark County as a promising location, then analyzed ZIP codes with a high density of major brands like McDonald's and Subway. By evaluating businesses operating during peak hours (10 AM to 2 PM), they identified gaps near the Las Vegas Strip - an area with high potential but minimal competition [2].
For local service-oriented businesses, such as HVAC or landscaping, focus on areas where complementary businesses thrive but direct competitors are scarce. High concentrations of chains like 7-Eleven or CVS can indicate strong commercial foot traffic - ideal spots for expansion [2]. Additionally, consider timing insights. For instance, neighborhoods without sufficient service during peak hours, like late mornings or weekends, can present untapped opportunities [1].
Once you’ve identified these gaps, leverage AI tools to turn your findings into actionable leads.
Optimizing Lead Generation with AI
AI-powered platforms can simplify and supercharge your lead generation efforts by transforming your market research into targeted campaigns. Tools like Cohesive AI, for example, can scrape Google Maps data to locate underserved business owners in specific areas. From there, it personalizes cold emails based on each prospect's unique needs and location. The platform even manages email deliverability, running up to three campaigns simultaneously, and guarantees at least four interested responses per month - or it offers a free month credit.
Feed your market analysis directly into these systems. Suppose your research shows a ZIP code with high demand for janitorial services but only two competitors. You can configure your outreach to prioritize businesses in that area. Use weighted suitability scores - built from metrics like population density and competitor presence - to rank leads effectively. This ensures your outreach doesn’t overly focus on one factor while ignoring others, like market saturation [2].
After launching your campaigns, keep an eye on performance and adjust strategies to match changing market trends.
Tracking and Refining Strategies
Market dynamics are always shifting, so your approach needs to stay flexible. Use engagement metrics from your Google Business Profile - like website clicks, phone calls, and direction requests - to gauge how well your outreach is performing [19][21]. For instance, if a high-potential region shows low website clicks, revisit your business descriptions and photos. Similarly, low direction requests could point to issues with your business category or address accuracy [21].
Track geographic performance using UTM-tagged URLs to attribute engagement to specific regions. Analyze click-through rates and direction request data to identify which areas are driving the most qualified leads [19][21].
Set a regular schedule - monthly or quarterly - to refresh your market analysis. Use tools like Places Insights to check for updates on competitor density and search volume trends. Keep an eye on shifts in "popular times" data, as these can reveal changes in customer behavior [20]. If an area you previously identified as underserved suddenly becomes crowded with competitors, pivot your focus to the next best opportunity. Platforms like Cohesive AI can automate much of this process, helping you adapt quickly without the need for constant manual updates.
Conclusion and Key Takeaways
Summary of Benefits
Google Maps data provides local service businesses with a powerful tool for smarter growth and marketing strategies. By layering data from state-level overviews down to hyper-local grids, you can pinpoint the best locations for expansion [2]. Tools like H3 hexagonal grid indexing allow you to visualize market density, making it easier to identify underserved areas without getting bogged down by overlapping data points [1][2]. When combined with public datasets, this spatial analysis gives you a well-rounded view of market opportunities.
Interactive geospatial reporting has also made it simpler for non-technical teams to engage with dynamic heatmaps, filtering insights by time, location, or business type [1]. Free tools like Looker Studio turn complex datasets into easy-to-understand visuals, empowering your team to make informed decisions [1]. This approach ensures that everyone can contribute to identifying growth opportunities, not just the data experts.
The key is to turn these insights into focused actions that deliver results quickly.
Actionable Next Steps
To capitalize on these benefits, start by setting clear market objectives. Identify the regions you want to target and the key data points you’ll need to analyze. Use methods like min-max normalization to create fair "suitability scores", balancing factors such as population size and competitor presence [2].
For industries like HVAC, landscaping, or janitorial services, consider automating lead generation with Cohesive AI. This tool leverages Google Maps data to locate business owners in your target areas, crafts personalized cold emails using AI, and manages your email campaigns. At $500 per month (plus a $75 setup fee and no long-term contracts), it guarantees at least four interested responses monthly - or you get a free month credit. This allows you to convert market research directly into qualified leads without relying on traditional agencies.
Finally, make it a habit to review your analysis on a monthly or quarterly basis. Keep an eye on performance metrics, shift your geographic focus as new data emerges, and refine your strategy to stay ahead of competition and adapt to changing customer behaviors.
FAQs
How can businesses use Google Maps data to analyze market trends and identify opportunities?
Businesses can tap into Google Maps data to spot market trends and uncover new opportunities by utilizing tools like the Places Insights and Places Aggregate APIs. These APIs offer key metrics, including business types, average ratings, price levels, and accessibility features within a defined area. For instance, you could analyze how many highly-rated HVAC contractors operate within a 10-mile radius of a specific ZIP code. By pairing this data with public geospatial information - like census demographics or income levels - businesses can pinpoint underserved markets, identify seasonal patterns, and discover thriving hotspots.
To turn this data into actionable insights, visualization tools like Looker Studio or other business intelligence platforms can be game-changers. Use heat maps to showcase competitor density, bar graphs to compare price levels, or time-series charts to observe rating trends over time. For industries like janitorial services, landscaping, or catering, Cohesive AI streamlines the process further by automating data collection, enriching it with insights, and creating tailored outreach campaigns. This method empowers businesses to target leads more effectively and make informed decisions to drive growth.
What key metrics should I focus on when collecting data from Google Maps for market analysis?
When building a data collection plan with Google Maps, focus on metrics that shed light on both business performance and consumer behavior. For businesses, key factors to track include place type (e.g., HVAC, landscaping), average user ratings, review counts, price levels, and service hours. Additionally, details like accessibility features, such as wheelchair access, can provide extra context about service quality and competition in your target area.
On the consumer side, pay attention to search trends, popular times, and activity spikes sourced from anonymized data. These metrics can highlight seasonal demand changes or growing interest in specific services, like home improvement. Analyzing these patterns over time can help you spot new opportunities as they emerge.
To ensure your insights are accurate and useful, check your data’s geographic coverage, update frequency, and level of detail (e.g., daily versus weekly updates). Tools like Cohesive AI simplify this process by gathering and analyzing Google Maps data, making it easier to generate actionable insights for industries such as janitorial services, landscaping, and HVAC.
How does AI improve lead generation with Google Maps data?
AI makes lead generation easier and more efficient by automatically collecting essential details such as business names, categories, addresses, and contact information directly from Google Maps. This information is neatly organized into structured data, which can then be used to build precise and personalized lead lists.
Beyond data collection, AI helps businesses design customized email campaigns that feel relevant and engaging to their audience. This not only saves time but also boosts accuracy, making it simpler for businesses to connect with the right prospects and improve their outreach efforts.